KS3 Geography › Global inequalities and development

KS3 Geography › Global inequalities and development
These are the points the worksheet questions are built around.
The United Kingdom has one of the largest economies on the planet, yet roughly a fifth of the people who live there are in poverty. Kenya, by contrast, has an average income many times lower than the UK's, and yet some Kenyan families live in big brick houses protected by security gates. The reason both can be true is the heart of this lesson: a single figure about a country says surprisingly little about how the people in it really live.
To understand lives in other places, geographers gather several kinds of evidence. Statistics, such as income or life expectancy, are useful, but numbers on their own leave a lot out. Interviews fill some of the gaps by letting people explain their lives in their own words, while photographs and videos show what homes, kitchens and streets actually look like. A well-known example is Dollar Street, a website created by the Swedish foundation Gapminder. It photographs real family homes across the world and arranges them by income rather than by country, so families from different continents on similar incomes end up as neighbours. Even so, a photograph is only a clue. It captures one moment in one home, so any conclusion drawn from it needs care.
Geographers sort the differences between places into two groups. Physical geography covers the natural world, including climate, mountains, rivers and forests. Climate is not the weather on a particular day but the average weather of a place, measured over a long period, normally at least thirty years. Human geography deals with people, including wealth, housing, jobs and the laws a country follows. Real families are affected by both groups at once.
The lesson then looks at three real families. In Pakistan, a family rents a flat in a tall apartment block; the father works as an officer on a merchant ship and the flat has a modern fitted kitchen. In Tanzania, both parents are employed at a university and the family lives in a modern single-storey house. In Peru, the mother is a farmer, her daughter works as a cook in a local restaurant, and the family cooks over an open fire. They share more than might be expected. Each home is made of brick or stone, someone in each family works, each family owns a mobile phone, and the children all find ways to play outdoors. The differences lie in the details, such as how big the home is, how the family cooks and what the phone is able to do. All of these differences are between countries, but some of the biggest gaps of all are found within a single country.
Spotting those gaps starts with GDP per capita. This is the total value of the goods and services a country produces in one year, divided by the number of people living there, so it works as an average share for each person. Even after taking into account that many things cost less in Kenya, the UK's GDP per capita is around nine times higher. That does not mean every Kenyan is poorer than every person in the UK. An average hides how widely values are spread. In a room of ten people where one is a billionaire, the average wealth is huge, even though the other nine might be struggling to pay their bills. This uneven spread is known as inequality: the uneven sharing of resources, opportunities and living conditions.
Kenya shows how much variety one country can hold. The equator crosses Kenya, but its climate differs enormously from one area to another. More than three quarters of the country is arid or semi-arid, meaning dry land where rain is scarce and unreliable. Some places in the far north receive about 250 millimetres of rain a year or less. In contrast, parts of the highlands near Mount Kenya, the country's highest mountain, and the land towards Lake Victoria receive over 1,000 millimetres a year. These cool, wet highlands, with their rich volcanic soils, are where most of Kenya's tea is grown.
The largest gap in Kenya, though, is not rainfall but money. Nairobi, the capital, has huge informal settlements, including Kibera, one of the largest in Africa. An informal settlement is an area where people build their own homes, often without proper planning or basic services. Many homes there have roofs made of metal sheets, and many families have no piped water at home. Nearby stand gleaming office towers and wealthy suburbs, where families live behind security gates with reliable water and electricity. In São Paulo, Brazil, the favela of Paraisópolis lies right beside the wealthy district of Morumbi, where luxury flats with swimming pools on their balconies stand just over the wall. In the UK, around one in five people live in poverty. The average is a real figure, but it cannot reveal which life any individual is living.
In short: geographers learn about lives around the world using statistics, interviews and photographs, and they look at both physical geography, such as climate, and human geography, such as wealth and housing. Families in Pakistan, Tanzania and Peru live differently but share a great deal. GDP per capita gives a rough picture of a country, but because it is an average it hides inequality, which is why rich and poor can live side by side in Kenya, in Brazil and in the UK.
These are the words that appear as key term cards in the video — worth knowing cold before the test.
Short clips from this lesson. Good for a quick refresh before a test.
Revising for a test? Key terms, objectives and quiz questions on one printable page.
The 3 questions from the video, one at a time. See if you caught them.
1. Which of these is NOT part of physical geography?
Why: Wealth is about people and money, so it belongs to human geography.
2. Roughly what share of Kenya is arid or semi-arid?
Why: Most of Kenya is dry land, where rain is scarce and unreliable.
3. Kenya's average income is lower than the UK's. So which of these is true?
Why: An average hides the spread, and both countries have very rich and very poor people.
Score: 0 out of 3 —
Want more practice? Try the 60-second Quiz Challenge →
One page with a full answer key. Enough to check the lesson landed, and to see how the questions are written before you buy anything.
Get the free worksheet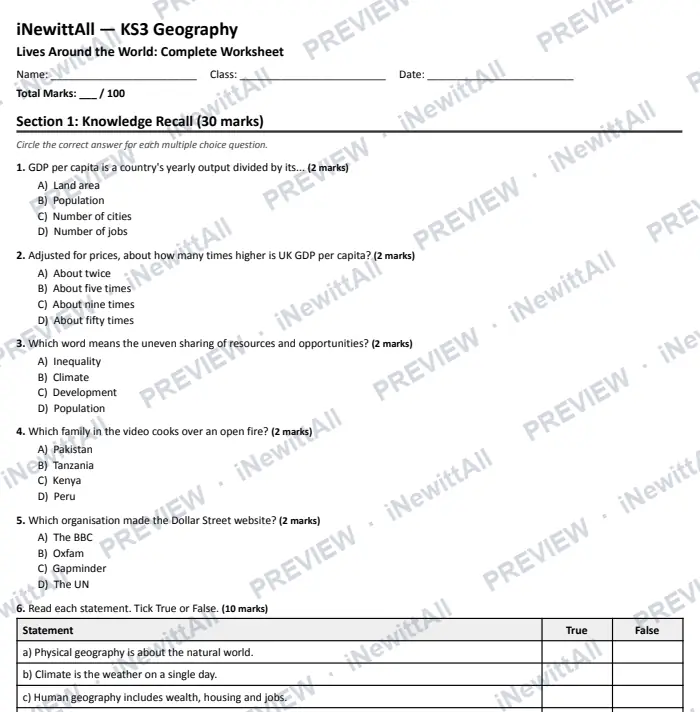
The top of page 1. The answer key is included when you buy.
£5 £6
The full worksheet and the extension pack together, with both answer keys.
Instant download with full answer keys. Print as many copies as your class needs.
£3
£3
£5 £6
Tick it off to track your progress. It's saved on this device. See my revision →
Students watch the video and do the quiz. They get a result card to paste back to you, showing their first try and best score.
This lesson's quiz questions on one sheet, with the answer key on page 2.
The quiz in big text for your classroom screen, one question at a time. Or build a 5-question Do Now starter from lessons your class has already done.
You're welcome to embed the video and link these resources in Google Classroom, Stile, Canvas, Compass or any other school platform. No need to ask.
Everything here is written to the KS3 curriculum for students aged 11–14. Print freely for the classes you teach.
 Next lessonIntroduction to Tourism
More in this unit: Global inequalities and development
No spam, unsubscribe anytime. You must be 13 or over to sign up.