KS3 Geography › Weather and climate

KS3 Geography › Weather and climate
These are the points the worksheet questions are built around.
Weather is the short-term, day-to-day condition of the atmosphere — whether it's sunny, cloudy, raining, or windy right now — and it can change from hour to hour and place to place; even two UK cities 50 miles apart can have completely different weather. Weather includes temperature, sunshine, wind, humidity, and precipitation, which is any moisture falling from the sky, including not just rain but also snow, sleet, and hail.
Climate is different: it's the average weather conditions of a place taken over a long period, usually 30 years or more. Rather than asking what it's doing outside today, climate asks what the weather typically does over decades. This is often summarised as "weather is what we get, climate is what we expect" — if you plan a July holiday to Spain expecting heat and sunshine, that's based on climate, even if the weather on a particular day turns out different. The UK has a temperate maritime climate: generally mild, wet throughout the year, with few extremes.
Seasons are caused by the tilt of the Earth on its axis, not by the Earth's distance from the sun (in fact, the Earth is slightly further from the sun during the UK's summer). As the Earth orbits the sun, the Northern Hemisphere (where the UK is) tilts toward the sun for part of the year, bringing longer days and warmer temperatures — summer — and tilts away from it for the rest, bringing shorter days and colder temperatures — winter.
Climate data is often displayed using a climate graph, which shows both temperature and precipitation for each month of the year on two different y-axes. The left y-axis shows temperature in degrees Celsius, linked to a red line — the higher the line, the warmer that month. The right y-axis shows precipitation in millimetres, linked to blue bars — the taller the bar, the more precipitation fell.
Reading a UK climate graph shows the red temperature line lowest in January and February and peaking in July and August, matching the seasonal pattern, while the blue precipitation bars stay fairly consistent all year, typically between 50 and 70mm a month — confirming the UK's wet, temperate maritime climate. Compared to somewhere like Yakutsk in Russia, where temperatures drop to around -20°C or lower for much of the year, the UK's lowest point still sits a few degrees above zero — a striking contrast for two places on the same planet.
Comparing Coventry in the UK with Ushuaia in Argentina reveals another striking pattern. Both places have seasonal climate graphs with reasonable precipitation year-round, but the UK's temperature stays above 0°C all year, while Ushuaia's drops below zero for five months. Their warmest months are also completely opposite: Coventry is warmest from April to September, while Ushuaia is warmest from October to March. This is because Argentina sits in the Southern Hemisphere, so when the Northern Hemisphere tilts toward the sun for summer, the Southern Hemisphere tilts away into winter, and vice versa six months later.
In short: weather is the short-term daily state of the atmosphere, while climate is the long-term average over 30+ years. The UK's temperate maritime climate is mild and wet, its seasons are driven by the tilt of the Earth's axis, and climate graphs — plotting temperature as a red line and precipitation as blue bars — allow direct comparison between climates anywhere in the world, including places with opposite seasons due to being in a different hemisphere.
These are the words that appear as key term cards in the video — worth knowing cold before the test.
Short clips from this lesson. Good for a quick refresh before a test.
Swipe sideways to see more →
Revising for a test? Key terms, objectives and quiz questions on one printable page.
The 3 questions from the video, one at a time. See if you caught them.
1. True or false — is climate the same as weather?
Why: Weather is what is happening day to day, like today's rain. Climate is the average weather over many years, usually about 30. So they are not the same.
2. Which axis do you use to read temperature on a climate graph?
Why: On a climate graph, temperature is shown by the line and read from the left-hand axis. Rainfall is shown by the bars and read from the right-hand axis.
3. Why are the warmest months in the UK and Argentina at opposite times of year?
Why: The UK and Argentina are in different hemispheres, so their seasons are opposite. When the UK is tilted towards the sun in summer, Argentina is tilted away from it.
Score: 0 out of 3 —
Want more practice? Try the 60-second Quiz Challenge →
One page with a full answer key. Enough to check the lesson landed, and to see how the questions are written before you buy anything.
Get the free worksheet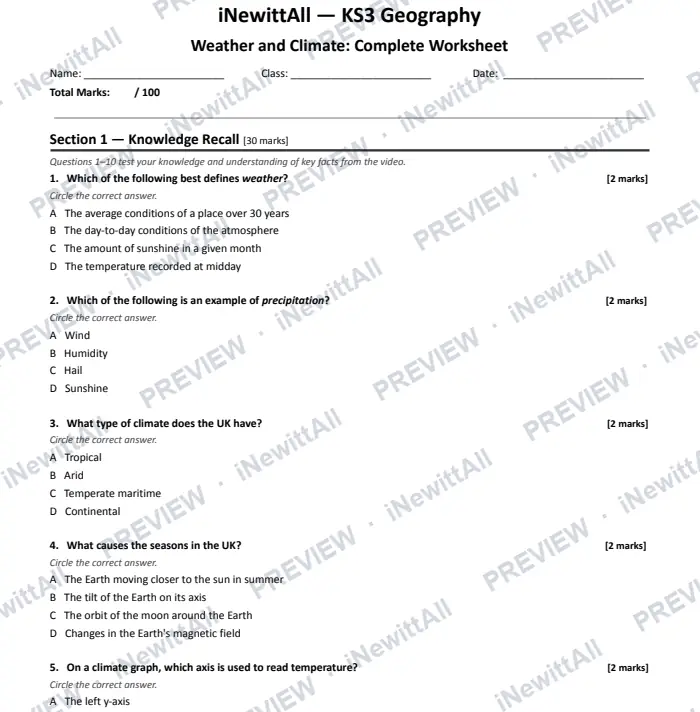
The top of page 1. The answer key is included when you buy.
£5 £6
The full worksheet and the extension pack together, with both answer keys.
Instant download with full answer keys. Print as many copies as your class needs.
£3
£3
£5 £6
Tick it off to track your progress. It's saved on this device. See my revision →
Students watch the video and do the quiz. They get a result card to paste back to you, showing their first try and best score.
This lesson's quiz questions on one sheet, with the answer key on page 2.
The quiz in big text for your classroom screen, one question at a time. Or build a 5-question Do Now starter from lessons your class has already done.
You're welcome to embed the video and link these resources in Google Classroom, Stile, Canvas, Compass or any other school platform. No need to ask.
Everything here is written to the KS3 curriculum for students aged 11–14. Print freely for the classes you teach.
 Next lessonWorld Climate Zones
More in this unit: Weather and climate
No spam, unsubscribe anytime. You must be 13 or over to sign up.